NBT BANCORP ANNOUNCES YEAR TO DATE EARNINGS OF $23.4 MILLION;DECLARES CASH DIVIDEND
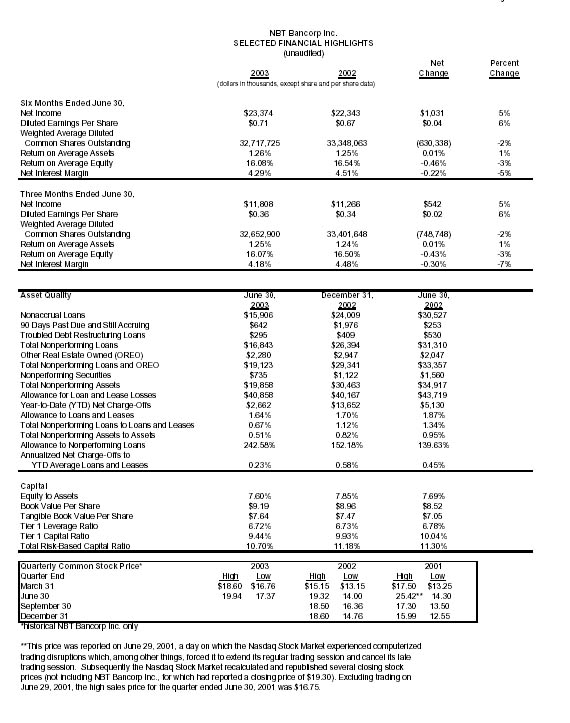
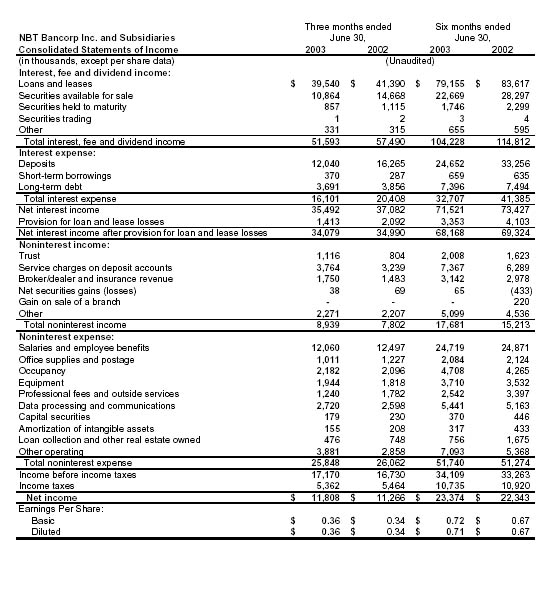
NORWICH, NY (July 28, 2003) – NBT Bancorp Inc. (NBT) (NASDAQ: NBTB) reported today that net income for the six months ended June 30, 2003 was $23.4 million, or $0.71 per diluted share, up 6% compared to $22.3 million or $0.67 per diluted share for the first six months of 2002. Return on average assets and return on average equity were 1.26% and 16.08%, respectively, for the six months ended June 30, 2003, compared with 1.25% and 16.54%, respectively, for the same period in 2002. The increase in net income for the six months ended June 30, 2003 was primarily the result of a $2.5 million increase in noninterest income partially offset by a $1.9 million decrease in net interest income.
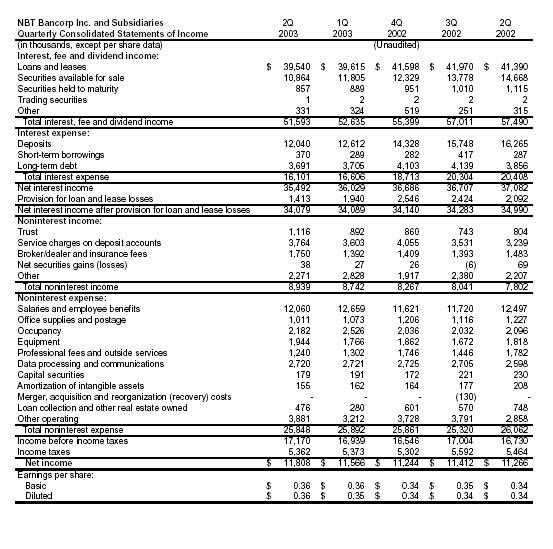
Net income for the quarter ended June 30, 2003 was $11.8 million, or $0.36 per diluted share, up 6% from $11.3 million, or $0.34 per diluted share for the same period a year ago. Return on average assets and return on average equity were 1.25% and 16.07%, respectively, for the quarter ended June 30, 2003, compared with 1.24% and 16.50%, respectively, for the same period in 2002. The increase in net income for the quarter ended June 30, 2003 was primarily the result of a $1.1 million increase in noninterest income, and decreases of $0.7 million for the provision for loan and lease losses and $0.2 million for noninterest expense offset by a $1.6 million decrease in net interest income.
NBT Chairman, President and CEO Daryl R. Forsythe stated, “The Company achieved positive results for the quarter and first-half of the year with strong revenue growth from service charges on deposit accounts, financial services and trust income, as well as improved credit quality, and expense control. We also produced strong growth in loans and deposits in the second quarter of 2003, growth that is directly related to the execution of our strategy to expand our delivery of full-service community banking throughout upstate New York and northeastern Pennsylvania.”
Mr. Forsythe continued, “During the second quarter of 2003, the Company acquired its 110th branch located in Whitney Point, New York, expanding our geographical presence in the state's Southern Tier. Our plans for the second half of 2003 call for the opening of two branches in the Albany market. This expansion of our footprint will provide more opportunities for our organization to serve a growing customer base, while adding diversity in the markets and economies we will serve in the years to come.”
Loan and Lease Quality and Provision for Loan and Lease LossesMr. Forsythe commented, “Despite challenging economic conditions and strong loan growth during the first half of 2003, we continue to see improvement in credit quality. This achievement speaks highly of our credit management process and business development activities.” Nonperforming loans at June 30, 2003 were $16.8 million or 0.67% of total loans and leases compared to $31.3 million or 1.34% of total loans and leases at June 30, 2002 and $26.4 million or 1.12% of total loans and leases at December 31, 2002. The Company's allowance for loan and lease losses was 1.64% of loans and leases at June 30, 2003 compared to 1.87% at June 30, 2002 and 1.70% at December 31, 2002. The ratio of the allowance for loan and lease losses to nonperforming loans improved to 242.58% at June 30, 2003 from 139.63% at June 30, 2002 and 152.18% at December 31, 2002. Annualized net charge-offs to average loans and leases for the six months ended June 30, 2003, were 0.23%, down from the 0.45% annualized ratio for the six months ended June 30, 2002, and down from the year-to-date December 31, 2002 rate of 0.58%.
For the six months and quarter ended June 30, 2003, the provision for loan and lease losses totaled $3.4 million and $1.4 million, down from the $4.1 million and $2.1 million provided in the same periods in 2002. The decrease in the provision for loan and lease losses for the six months and quarter ended June 30, 2003 when compared to the same periods in 2002 was due primarily to lower net charge-offs and a decrease in nonperforming loans.
Net Interest IncomeNet interest income for the six months ended June 30, 2003 decreased 3% to $71.5 million from $73.4 million in the same period for 2002. The Company's net interest margin was 4.29% for the six months ended June 30, 2003 compared to 4.51% for the same period a year ago. Net interest income was down 4% to $35.5 million for the quarter ended June 30, 2003, compared to $37.1 million for the same period a year ago. The decrease in net interest income was primarily attributable to the decline in the Company's net interest margin, which was 4.18% for the quarter ended June 30, 2003, down from the 4.48% for the same period in 2002. Mr. Forsythe stated, “The extraordinarily low interest rate environment that currently exists has presented a challenge in maintaining our net interest margin. In spite of an aggressive interest pricing strategy on both sides of the balance sheet and constant analysis of the most favorable asset/liability mix, our margins decreased during the second quarter of 2003. We feel fortunate we were able to mitigate the effect of margin compression with improving credit quality, increasing noninterest income and controlling noninterest expense.”
The compression in net interest margin during the six months and quarter and ended June 30, 2003 compared to the same periods last year resulted from earning assets repricing down at a faster rate than interest-bearing liabilities. This net interest margin compression was also impacted by accelerating prepayments from mortgage-related loans and various securities, which in turn were reinvested at lower rates. For the remainder of 2003, the Company expects its net interest margin to continue to compress from the quarter ended June 30, 2003 levels if the interest rate environment remains at current levels or lower.
Noninterest IncomeNoninterest income for the six months ended June 30, 2003 was $17.7 million, up $2.5 million or 16% from $15.2 million for the same period in 2002. Service charges on deposit accounts for the six months ended June 30, 2003 increased $1.1 million or 17% over the same period in 2002. The increase in service charges on deposit accounts resulted primarily from higher fees collected for insufficient funds on deposit accounts and continued growth from core deposits. Other income for the six months ended June 30, 2003 increased $0.5 million or 12% over the same period in 2002. The increase in other income was driven primarily by strong growth in ATM fees. Securities transactions resulted in a $0.1 million net gain for the six months ended June 30, 2003 and a $0.4 million net loss resulting from a write-down of an impaired security for the same period in 2002. Revenue from trust services increased $0.4 million or 24% for the six months ended June 30, 2003 over the same period in 2002, due in part to higher fees collected for estate management services as well as an increase in assets under management resulting from improved stock market conditions and an increase in managed trust accounts.
Noninterest income for the quarter ended June 30, 2003 was $8.9 million, up $1.1 million or 15% from $7.8 million for the same period in 2002. Service charges on deposit accounts for the quarter ended June 30, 2003 increased $0.5 million or 16% over the same period in 2002. The increase in service charges on deposit accounts resulted primarily from higher fees collected for insufficient funds on deposit accounts. The increase in fees for insufficient funds was driven primarily by the combination of continued growth in core deposit products as well as several pricing adjustments implemented during 2002. Revenue from trust services increased $0.3 million or 39% for the quarter ended June 30, 2003 over the same period in 2002, due in part to an increase in estate management services. Broker/dealer and insurance revenue increased $0.3 million or 18% for the quarter ended June 30, 2003 over the same period in 2002, due primarily to the Company's successful initiative in delivering financial service related products through its 110-branch network, which was implemented at the end of 2002. Mr. Forsythe stated, “We've developed a concentration of talent and resources that is able to respond to the complex financial needs of our customers. And, as a result, our strategy of offering a broad range of financial service products throughout our branch network is beginning to pay dividends and diversify our revenue sources.”
Noninterest ExpenseNoninterest expense for the six months ended June 30, 2003 was $51.7 million, up $0.5 million or 1% from $51.3 million for the same period in 2002. The increase in noninterest expense was due primarily to increases in other operating expense and occupancy expense partially offset by decreases in loan collection and OREO expenses and professional fees and outside services. Other operating expense increased $1.7 million, primarily from a $0.6 million charge for the writedown of venture capital investments. Loan collection and OREO expenses decreased $0.9 million from gains on the sale of OREO and a decrease in nonperforming loans. Professional fees and outside services decreased $0.9 million primarily from a $0.4 million charge related to an adverse judgement against the Company in 2002 as well as legal fees incurred during 2002 for the recovery of deposit overdraft writeoffs.
Noninterest expense for the quarter ended June 30, 2003 was $25.8 million, down $0.2 million or 1% from $26.1 million for the same period in 2002. The reduction in noninterest expense resulted from decreases in several line items and was partially offset by an increase in other operating expense. Professional fees and outside services decreased $0.5 million due to lower legal fees. Loan collection and other real estate owned (“OREO”) expense decreased $0.3 million, due to a decrease in nonperforming loans and gains on the sale of OREO. Other operating expense increased $1.0 million, due mainly to charges of $0.3 million for the writedown of venture capital investments in the quarter ended June 30, 2003.
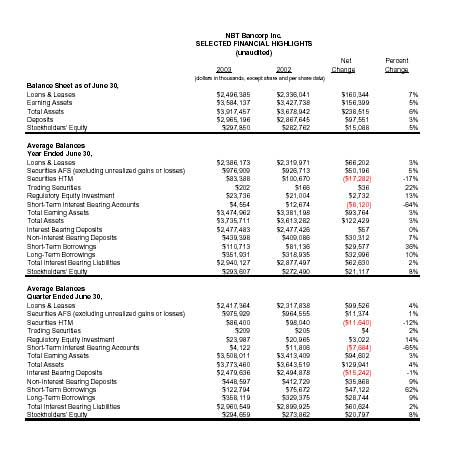
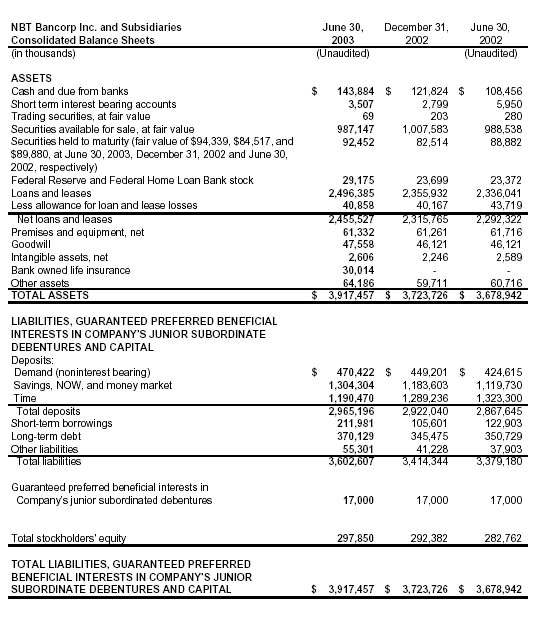
Balance SheetTotal assets were $3.9 billion at June 30, 2003, up $0.2 billion from $3.7 billion at June 30, 2002. Loans and leases increased $0.2 billion or 7% from $2.3 billion at June 30, 2002 to $2.5 billion at June 30, 2003. Loan growth has increased at an annual rate of 12% from December 31, 2002 levels. Loan growth was fueled primarily by consumer loans, particularly home equity loans, which experienced strong growth during the quarter ended June 30, 2003. Total deposits were $3.0 billion at June 30, 2003, up $0.1 billion from $2.9 billion at June 30, 2002. Core deposits, which include checking, savings and money market accounts increased $0.2 billion or 15% from $1.5 billion at June 30, 2002 to $1.8 billion at June 30, 2003, offset by a $0.1 billion decrease in time deposits during the same period. Stockholders' equity was $297.9 million, representing a Tier 1 leverage ratio of 6.72% at June 30, 2003, compared to $282.8 million or a Tier 1 leverage ratio of 6.78% at June 30, 2002.
Dividend DeclaredThe NBT Board of Directors declared a third quarter cash dividend of $0.17 per share at a meeting held today. The dividend will be paid on September 15, 2003 to shareholders of record as of September 1, 2003.
Corporate OverviewNBT is a financial services holding company headquartered in Norwich, NY, with combined assets of $3.9 billion at June 30, 2003. The Company primarily operates through one full-service community bank with three geographic divisions and through a financial services company. NBT Bank, N.A. has 110 locations, including 44 NBT Bank offices and 26 Central National Bank offices in upstate New York and 40 Pennstar Bank offices in northeastern Pennsylvania. NBT also provides financial services related products through M. Griffith, Inc. More information about NBT's banking divisions can be obtained on the Internet atwww.nbtbank.com, www.pennstarbank.comand www.canajocnb.com.
Forward-Looking StatementsThis news release contains forward-looking statements. These forward-looking statements involve risks and uncertainties and are based on the beliefs and assumptions of the management of NBT Bancorp Inc. and its subsidiaries and on the information available to management at the time that these statements were made. There are a number of factors, many of which are beyond NBT's control, that could cause actual conditions, events or results to differ significantly from those described in the forward-looking statements. Factors that may cause actual results to differ materially from those contemplated by such forward-looking statements include, among others, the following possibilities: (1) competitive pressures among depository and other financial institutions may increase significantly; (2) revenues may be lower than expected; (3) changes in the interest rate environment may reduce interest margins; (4) general economic conditions, either nationally or regionally, may be less favorable than expected, resulting in, among other things, a deterioration in credit quality and/or a reduced demand for credit; (5) legislative or regulatory changes, including changes in accounting standards and tax laws, may adversely affect the businesses in which NBT is engaged; (6) competitors may have greater financial resources and develop products that enable such competitors to compete more successfully than NBT; and (7) adverse changes may occur in the securities markets or with respect to inflation. Forward-looking statements speak only as of the date they are made. Except as required by law, NBT does not undertake to update forward-looking statements to reflect subsequent circumstances or events.
FINANCIAL TABLES APPEAR ON FOLLOWING PAGES